


Show a widget as a chart
Show the data of a widget as a bar chart or a line chart instead of a table, and let the widget span the whole width of the Dashboard.
Before you start
You need:
- Access to the Dashboard (Dashboard in the side menu)
- A widget on your Dashboard
New to the app? Start with Sign in to the web app.
When to use it
When you want to see at a glance how the indicators of your units change from period to period.
Step by step
-
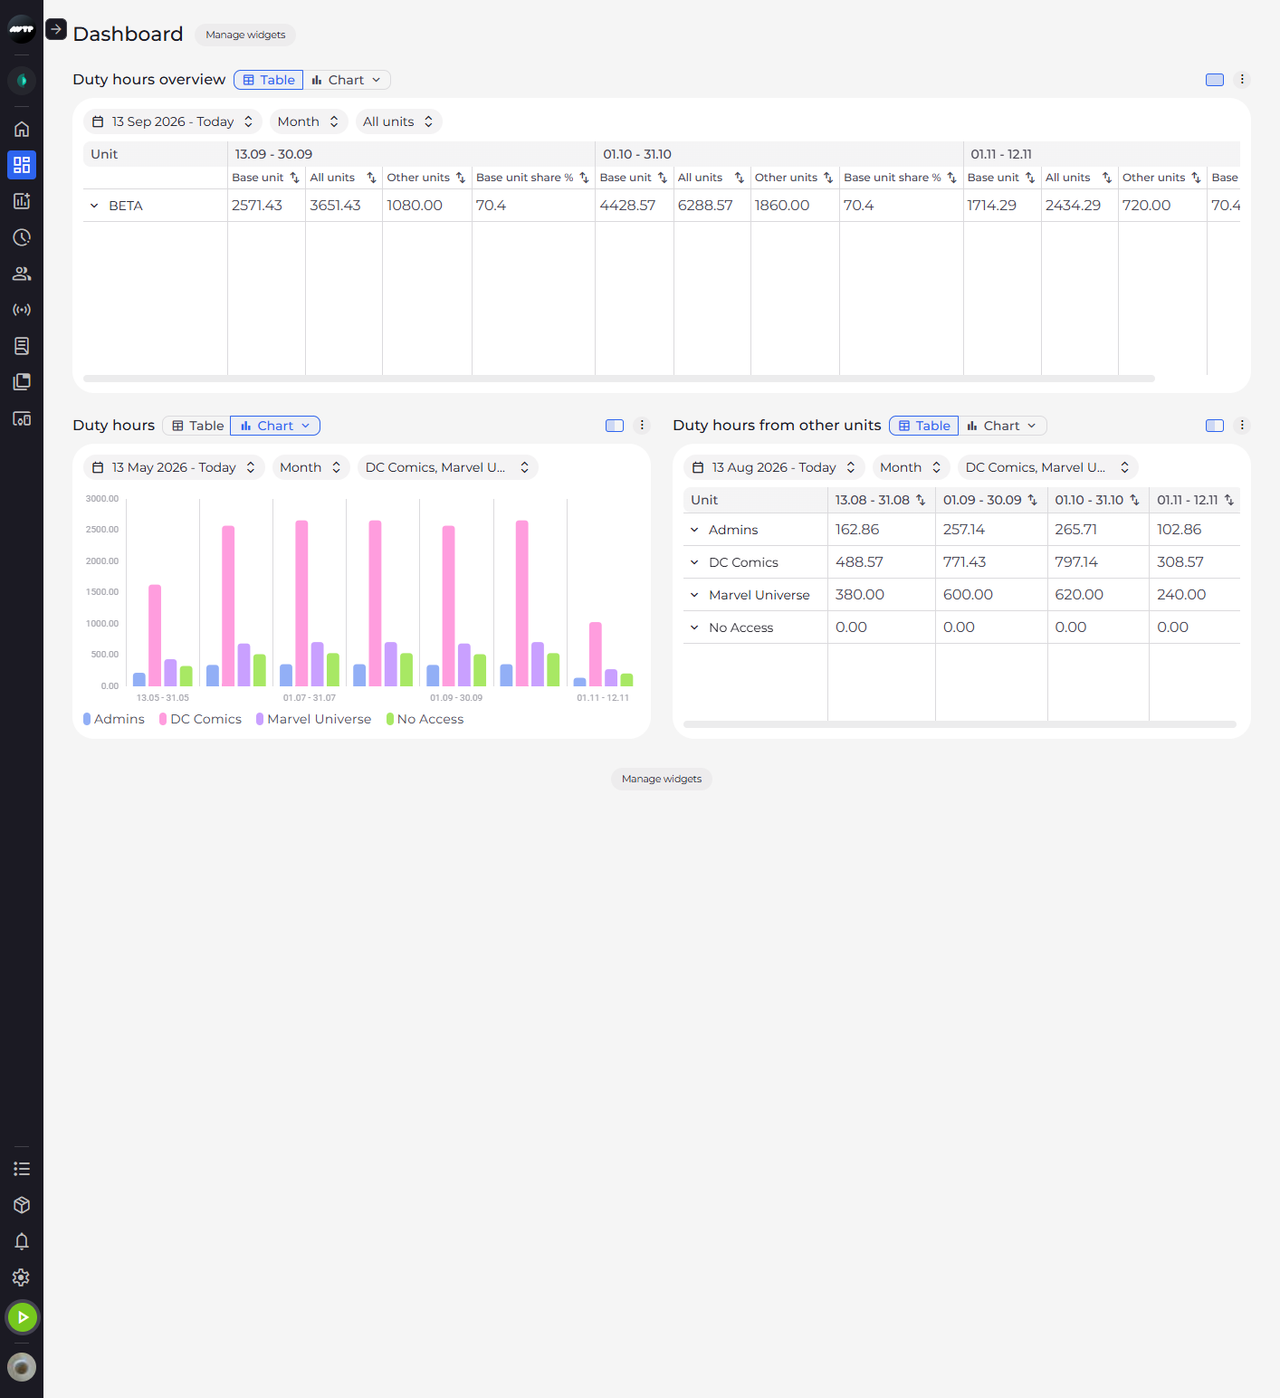
Step 1: Every widget starts as a table or a chart - this one is a table
Click Dashboard in the side menu. Next to the name of each widget is the Table / Chart switch, and the highlighted button shows the current view. In this example, the widget on the right shows a table.
-
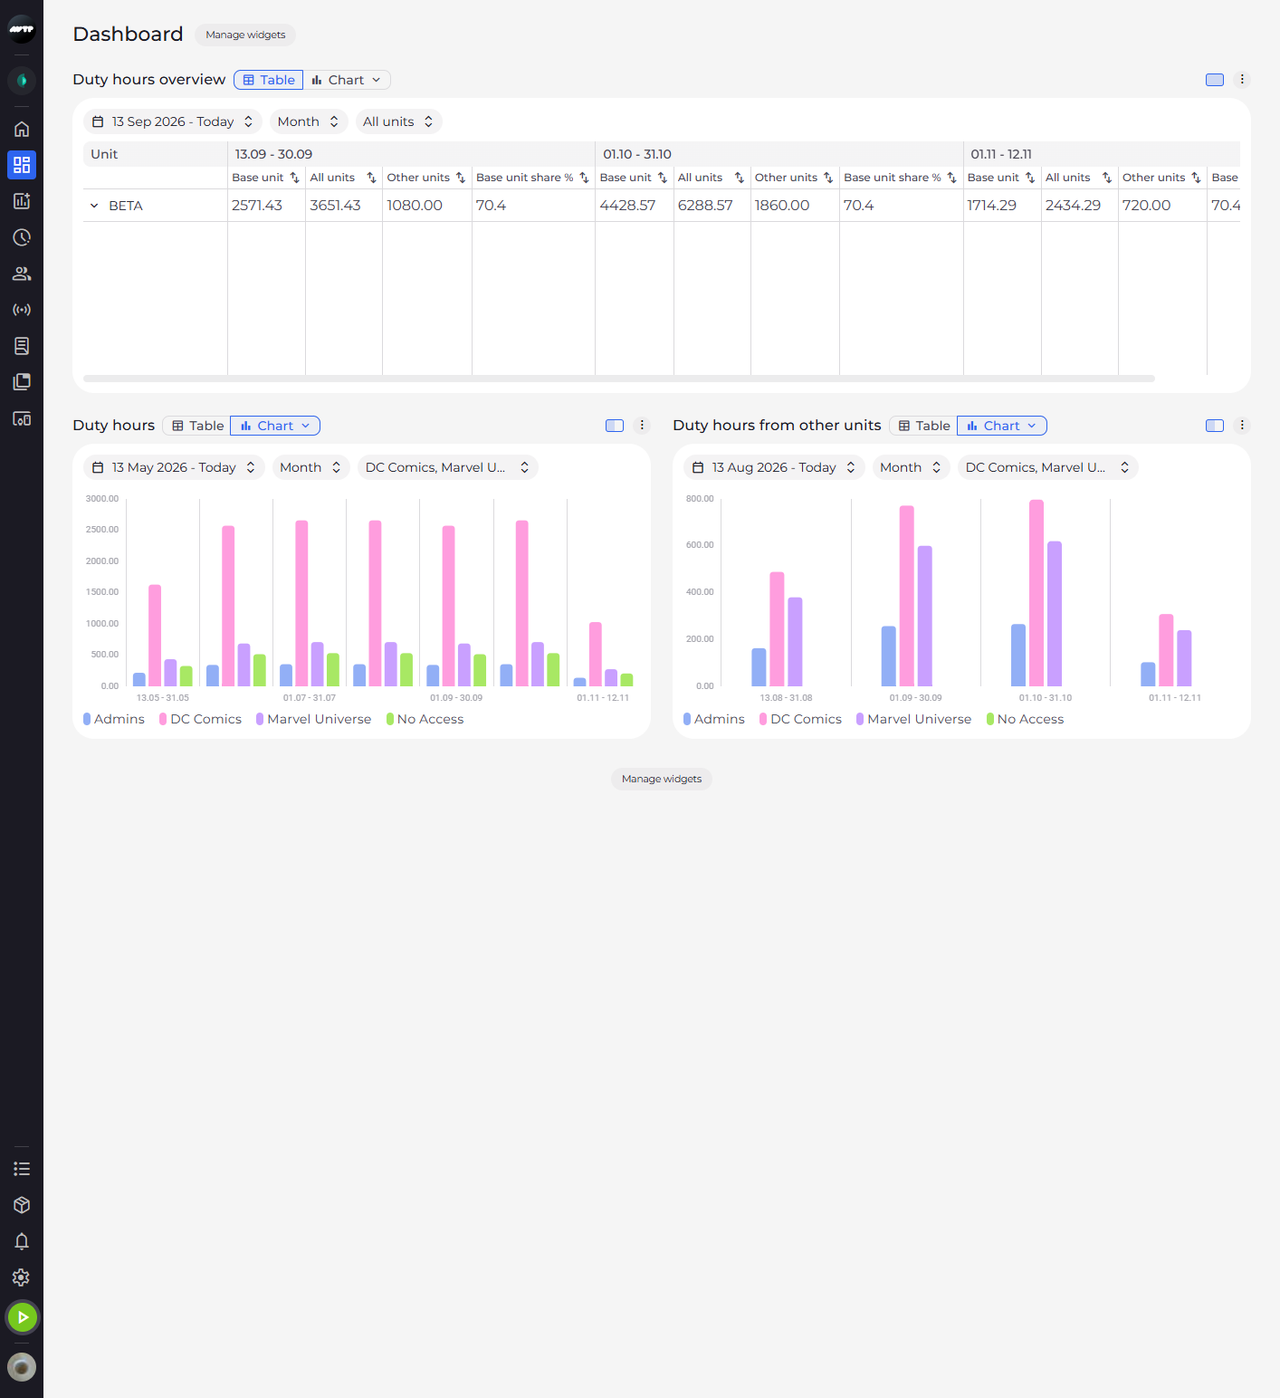
Step 2: Click Chart to see the same data as a bar chart
Click Chart next to the name of the widget. The same data appears as a bar chart: the periods run along the bottom, the values up the left side, and each period has one bar per unit.
Tip: Each unit has its own colour, named in the legend under the chart. Point at a period to see the values of every unit in it.
Tip: A period without a value - one that has not happened yet, or one that can't be computed - has no bar, and the pop-up shows "–" for it.
-
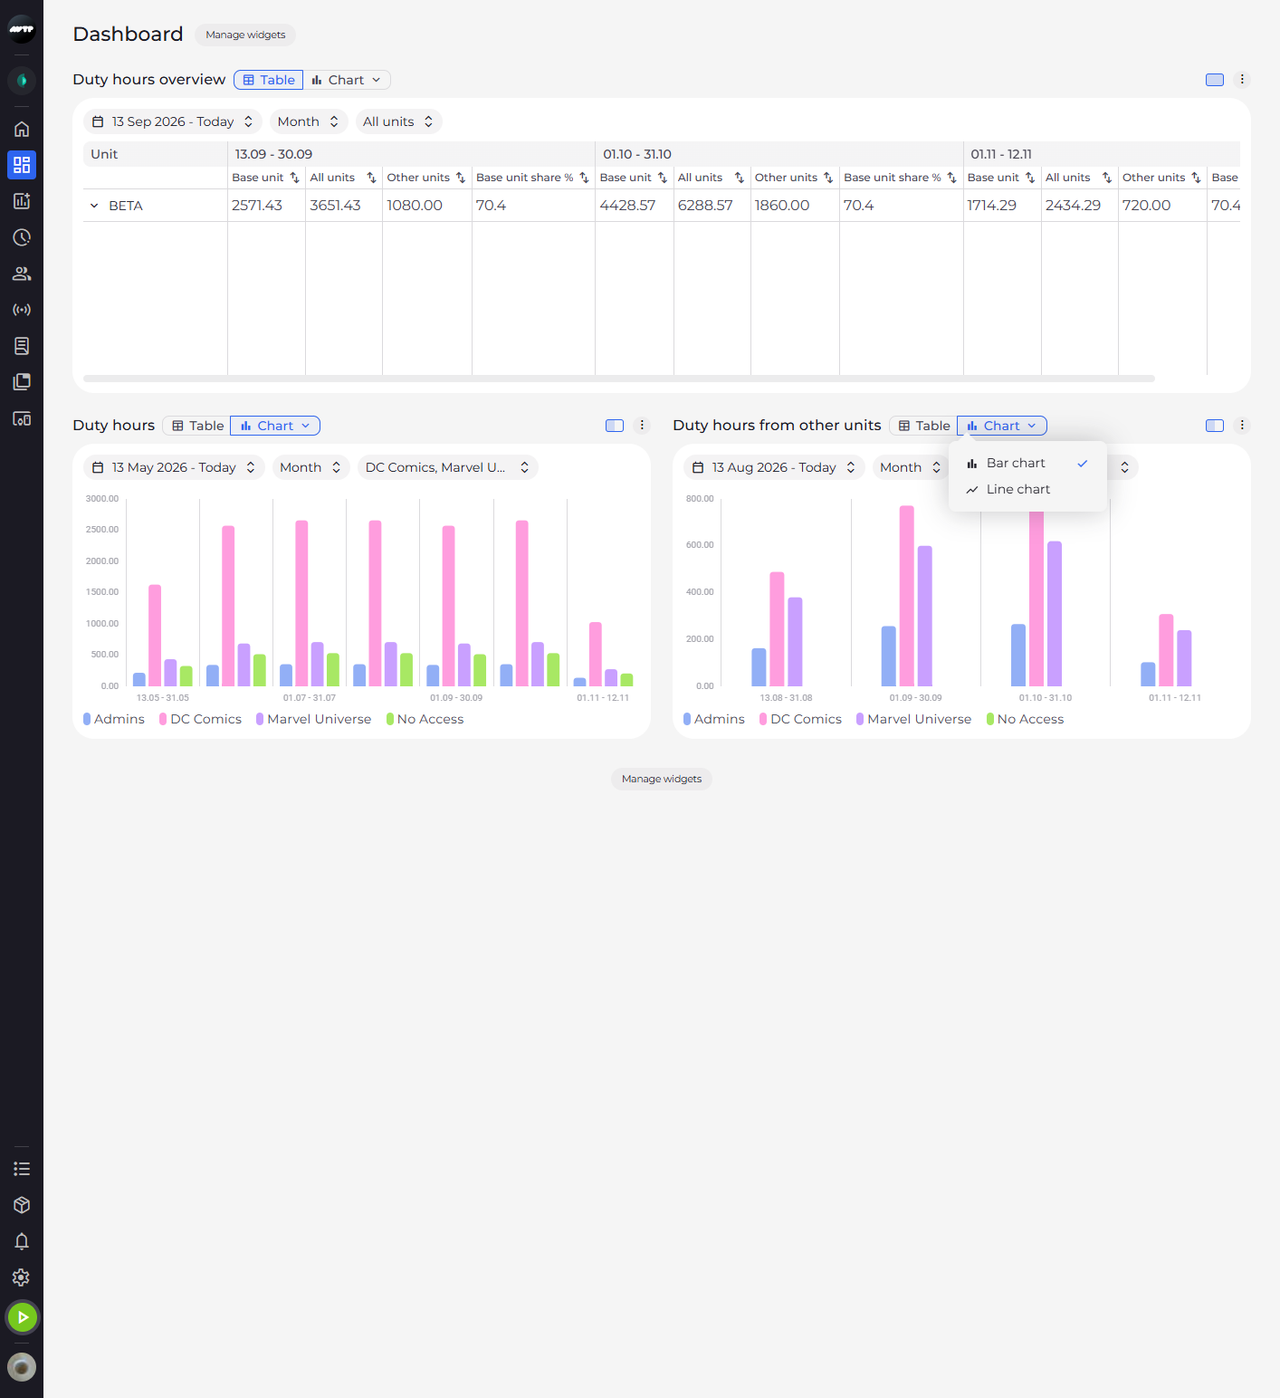
Step 3: Click Chart again to choose between a bar chart and a line chart
With the chart on, Chart has a small arrow. Click Chart again: a menu offers Bar chart, ticked because it is the current type, and Line chart.
-
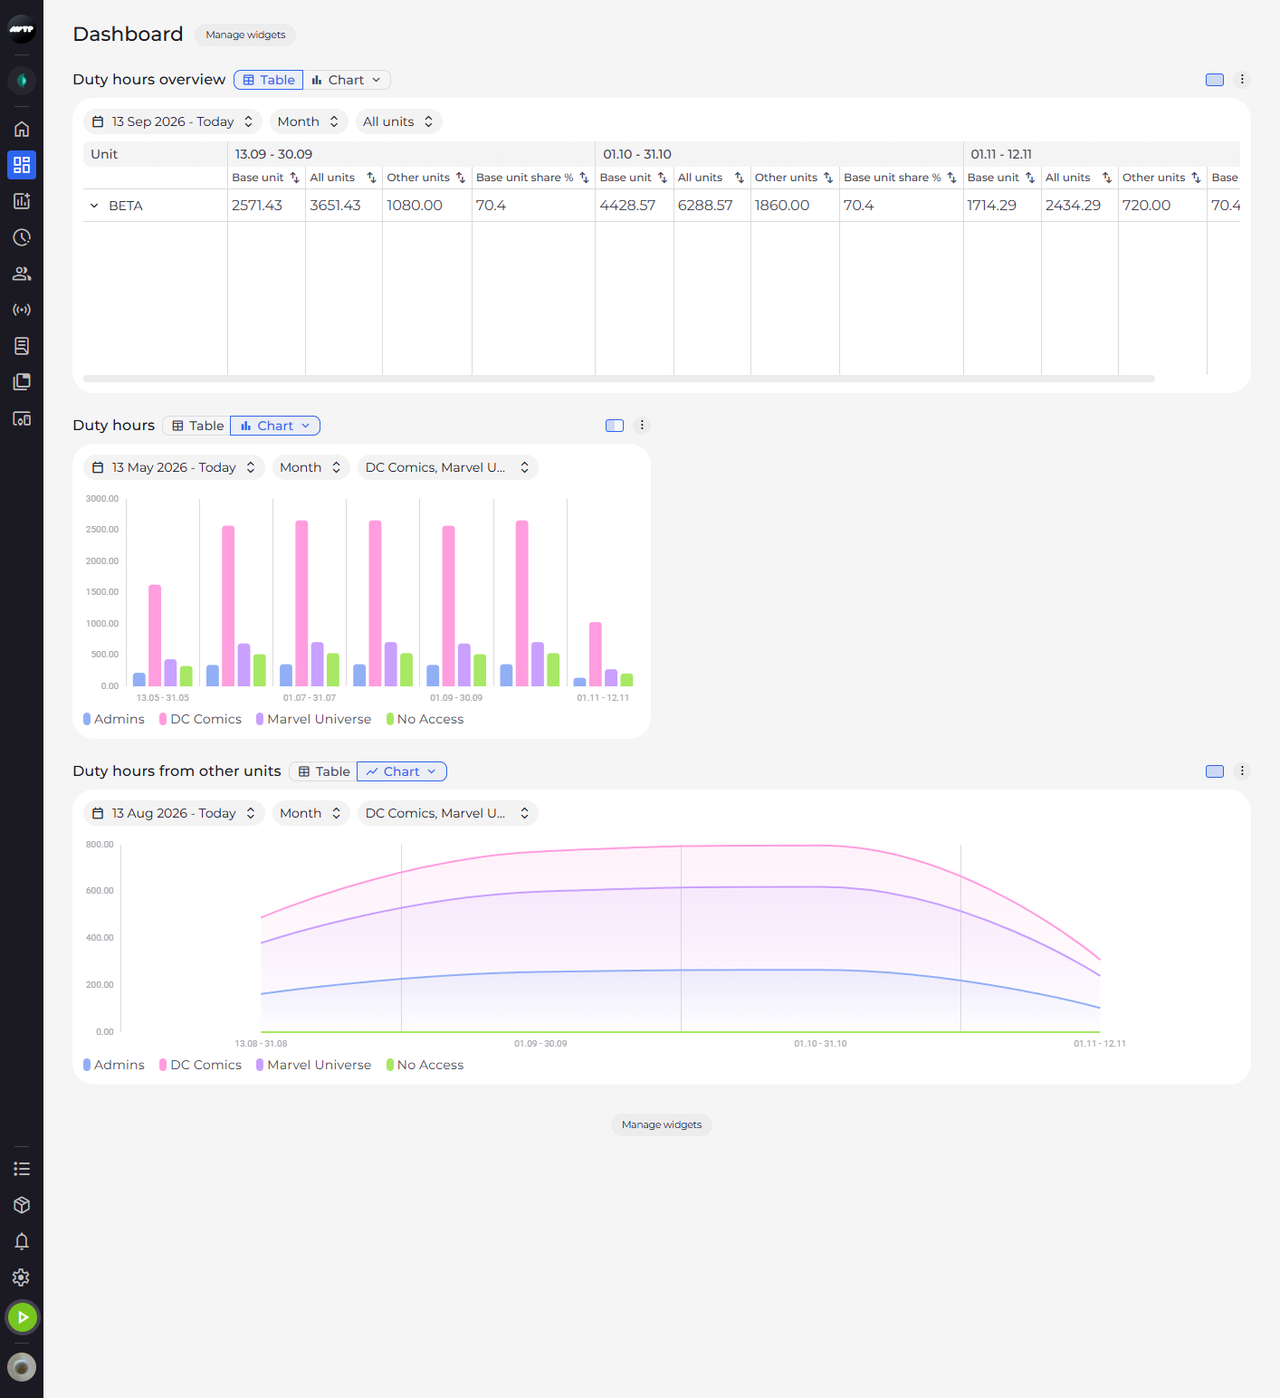
Step 4: The line chart across the whole page
Click Line chart. Then click the size button (Full width) at the right end of the widget's header, left of the ⋮ menu. The widget moves to a row of its own across the whole page and shows one line per unit.
Tip: Full width makes the widget span the page and Half width brings it back. The view, chart type and size you choose are saved for you and stay the next time you open the Dashboard.
What happens next
The widget shows its data as a line chart across the full width of the Dashboard.
Good to know
- With several indicators, each indicator is scaled to its own largest value and the indicator names sit above the bars, so compare heights only within one indicator. Point at a bar to read the real values.
- With the Week resolution, the chart labels the weeks W1, W2 and so on, counted from the first week shown - these are not calendar week numbers.
Questions
Why does the chart say "Too many units for a chart. Select fewer units or switch to the table."?
A chart shows at most 50 units. Click Show table to see the same data as a table, or choose fewer units in the units chip.