Widgets
Choose what you see
Pick which dashboard lists appear on your Dashboard as widgets, arrange them in your own order and remove the ones you don't need. Every manager has a Dashboard of their own.
How to manage widgets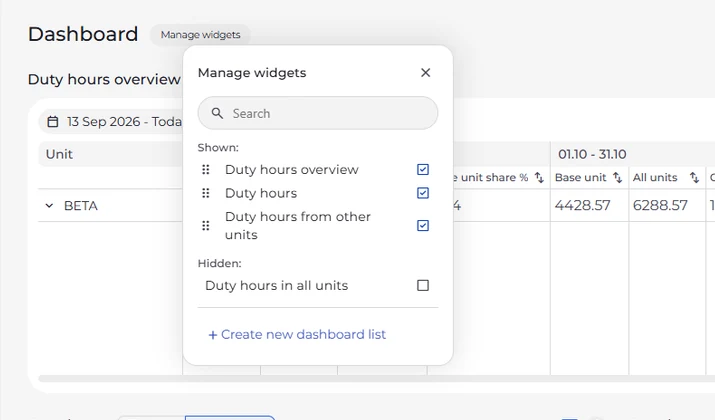

What's new · November 2026
Build your own page of widgets in the MyTimePlan web app. Each widget shows the indicators you choose – as a table or a chart, for the period and the units you pick.

Widgets
Pick which dashboard lists appear on your Dashboard as widgets, arrange them in your own order and remove the ones you don't need. Every manager has a Dashboard of their own.
How to manage widgets
Table or chart
Switch any widget between a table and a bar or line chart, and let it span the full width of the page. In a table, open the sub-units of a unit and sort the rows by any column.
How to show a widget as a chart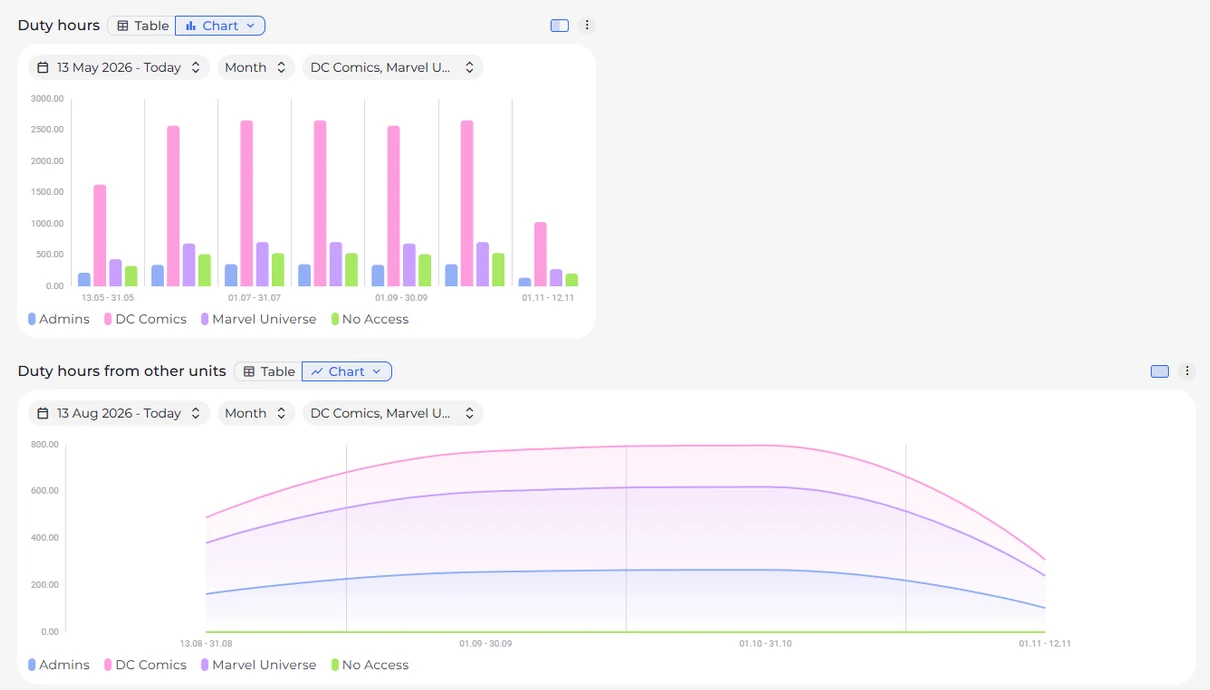
Period and units
Set the date range of each widget, choose how long one period is – a day, week, month, year, salary period or a length of your own saved as a preset – and pick the units from your unit tree. Each widget remembers its settings.
How to set the date range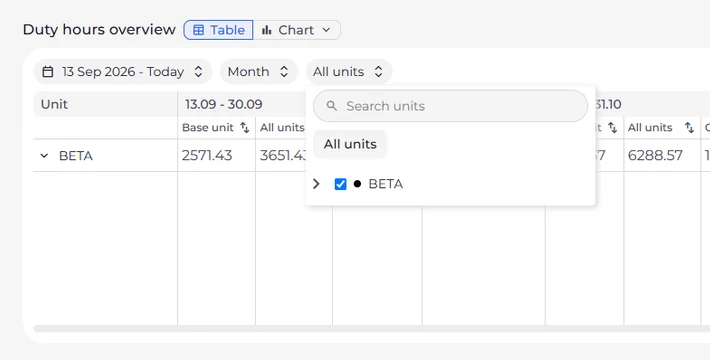
Your indicators
In Settings > Dashboard lists, decide which columns a widget shows. Combine indicators in a formula, choose how the values are displayed and set a minimum and a maximum value.
How to create a dashboard list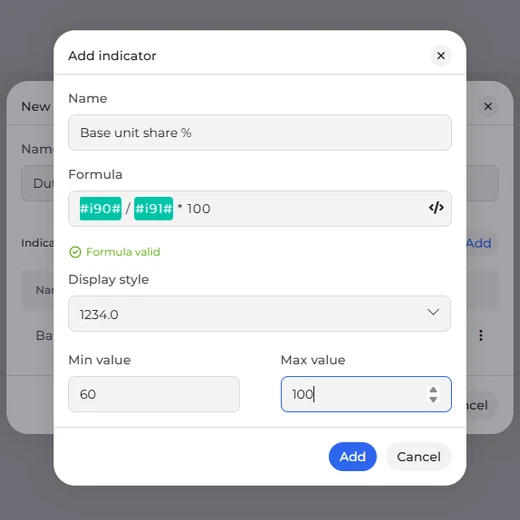
In the web app, click Dashboard in the side menu – the icon with four squares.
Click Manage widgets and choose the dashboard lists you want to see.
Set the date range, resolution and units. Each widget keeps its settings for next time.

Book a demo and see how MyTimePlan simplifies your operations, from hire to payroll.
Fill in the form and we’ll get in touch to:
 Understand your needs
Think of ways to overcome your daily challenges
Answer any questions